
Finding Free Keyword Tools That Actually Deliver Search Volume Data
Most free keyword tools hide volume data behind paywalls. These methods and tools still deliver actionable search metrics for zero cost.

If you’ve been hunting for a free seo keyword search tool that shows actual monthly searches instead of vague “high” or “low” labels, you know the routine: the interface looks promising, the suggestions are relevant, but the moment you need a number, the screen blurs a paywall or replaces digits with a range that could mean anything from a hundred to ten thousand. You aren’t imagining it. Most free tools deliberately obscure volume because accurate, up‑to‑date data is expensive to maintain, and they meter access behind paid plans. The trick isn’t finding a tool that says “free”—it’s knowing which sources start with first‑party search engine data and how to read them so you leave with defensible, specific estimates. This walkthrough covers the four most dependable zero‑cost sources, a simple method to cross‑reference them, and a repeatable workflow you can run without a credit card.
Why most free tools hide the numbers you need
Any service that doesn’t own a search engine index has to reconstruct keyword volume from third‑party clickstream panels, scraped SERP snapshots, or API extrapolations. That reconstruction requires continuous engineering and data licensing. So the business model gives away discovery—keyword suggestions, difficulty scores, maybe a trend line—and locks the precise volume behind a subscription. A browser extension might label a term “high competition” and show a bar, but the underlying count is a modeled estimate, not a measurement. Those models can be directionally useful, but they aren’t trustworthy for decisions that compare two similar keywords or estimate the traffic a new page could capture.
The tools below don’t have that problem. Google and Bing both expose their own search data through free interfaces, albeit with some friction. Add Google Search Console’s impression data—which isn’t volume but correlates strongly for well‑ranked pages—and you can triangulate reliable numbers without paying anyone.
Google Keyword Planner: the primary free volume source
Google Keyword Planner is the most cited free source for a reason: it pulls numbers directly from Google’s search logs. You access it through a Google Ads account. Opening an account is free, and you don’t need to run a campaign. Once inside, go to “Tools & settings” > “Keyword Planner” and choose “Discover new keywords.” You can seed it with terms, a competitor URL, or a product category phrase.
The results table gives you average monthly searches, competition (advertiser demand), and a top‑of‑page bid range. Without campaign spend, the Planner often shows volume as a range—e.g., 100–1,000—and that’s already more specific than “medium.” But you can get a tighter single‑number forecast: start a campaign draft, add keywords to it as if you were building a campaign, and then view the forecast column. That column replaces ranges with point estimates because the system has a mock budget to work against.
For programmatic access, the Keyword Ideas endpoint of the Google Ads API returns the same historical search volume without the UI range restriction. If you’re building an internal dashboard or an AI‑assisted research pipeline, that endpoint is the cleanest way to pull thousands of volume figures at once.
One caution: the 12‑month average smooths seasonality. A term averaging 2,000 searches might spike to 9,000 in November and drop to 300 in February. The Planner won’t warn you, so you’ll need Google Trends for the seasonal overlay (covered below).
Verification step: after exporting your keyword list, pick three terms and look up their Search Console impression counts for existing pages. A term that the Planner pegs at 500–1,000 searches should, if you hold a top‑five position, generate a comparable number of impressions. If impressions are an order of magnitude lower, the Planner’s broad‑match grouping might be capturing unrelated searches. Re‑run the analysis with a narrower match type or add the term to a mock campaign to see a more realistic forecast.
Search Console impressions as a volume proxy
Google Search Console doesn’t report search volume, but the Performance report tells you exactly how many times your pages appeared for a given query. Impressions ÷ search volume is remarkably stable for pages ranking in positions 1–3, typically between 0.6 and 0.9 depending on SERP features. If you already have content ranking for a cluster of terms, you can reverse‑engineer approximate volume by comparing those impressions against numbers the Planner gives for the same queries.
For net‑new discovery, open the Queries report, set the date range to at least 6 months, and sort by impressions. Many of the shown queries are long‑tail variations you haven’t explicitly targeted. Export that list, run it through the Planner to attach volume estimates, and decide which ones deserve their own landing pages. A software‑as‑a‑service site I worked with discovered 340 keyword variations for “security compliance checklist” this way; two became pillar pages that now drive 800 organic visits a month combined.
If you’re maintaining multiple domains, automate the pipeline. Pull Search Console data via the API into a spreadsheet or a research tool. SiaSEO, for instance, reads your site’s existing pages, extracts Search Console query data, and outputs a 7‑day content calendar with keywords clustered by intent, so you move from raw data to publishable topics without the manual pivot‑table labor. Whether you automate or not, the habit of exporting queries monthly and marrying them with Planner volumes builds a self‑reinforcing keyword engine that uses only Google’s own signals.
Bing Webmaster Tools: a second engine’s data
Microsoft’s Bing Webmaster Tools includes a free keyword research module that reports monthly search volume directly from Bing’s search network, along with competition scores and trending charts. Because the data comes from a completely different search engine, it gives you an independent sanity check. The Microsoft guidance notes that the same volume figures feed the Microsoft Advertising Keyword Planner, and you can retrieve them programmatically via the Ad Insight API’s GetKeywordIdeas operation.
To use it, sign up for a free Bing Webmaster Tools account, add your site, and navigate to “Keyword Research” under the “SEO” menu. Enter a seed term and you’ll see:
- Monthly searches for Bing (global or filtered by country)
- Bing ranking URLs currently appearing in the top results
- Keyword suggestions with their own volume and competition metrics
The absolute volume numbers will be lower than Google’s for most informational terms, because Bing’s US market share hovers around 6–7%. That doesn’t make them wrong; it makes them a triangulation partner. A keyword that shows similar relative demand on both engines—say, 1,200 in Planner and 180 in Bing—is likely a stable, real‑world search behavior. A term that appears as 15,000 in Planner and 20 in Bing warrants scrutiny. It might be an artifact of broad‑match inflation on Google’s side, or a term that only makes sense inside a specific Google feature like a Knowledge Panel query.
Google Trends for pattern, not precision
Google Trends does not return absolute search volume. It plots relative popularity on a 0–100 scale over a selected time window and geography. That’s a sharp limitation, but it’s also exactly what makes it useful for three tasks no volume table can handle.
Seasonality mapping. Plot a keyword over five years to see predictable cycles. When “tax filing software” spikes every February–March, you know to publish your comparison guide in January. When “virtual event platform” dropped permanently after 2022, you know not to bet a content cluster on it in 2026.
Comparative demand. Drop up to five terms into the same chart to see which phrase gets more interest over time. “Keyword research tool” vs. “keyword research free” shows the commercial intent variant outstrips the freebie seeker by 3×, even though neither number is a monthly search count.
Regional concentration. Drill down to state or metro level to see where interest clusters. If 70% of queries for a local service keyword come from three cities, you can prioritize location pages for those areas while de‑prioritizing the rest.
Run Trends after you pull volume from the Planner, not instead of it. If a Planner estimate says 2,000 monthly searches and Trends shows the keyword flatlining near zero for the past year, double‑check the Planner’s network filter (it may include display network traffic) or confirm you haven’t selected a broad‑match variant that captures unrelated queries.
Assembling a repeatable free research workflow
You don’t need to jump between a dozen tabs every time. A minimal stack that produces defensible volume estimates in under 20 minutes works like this.
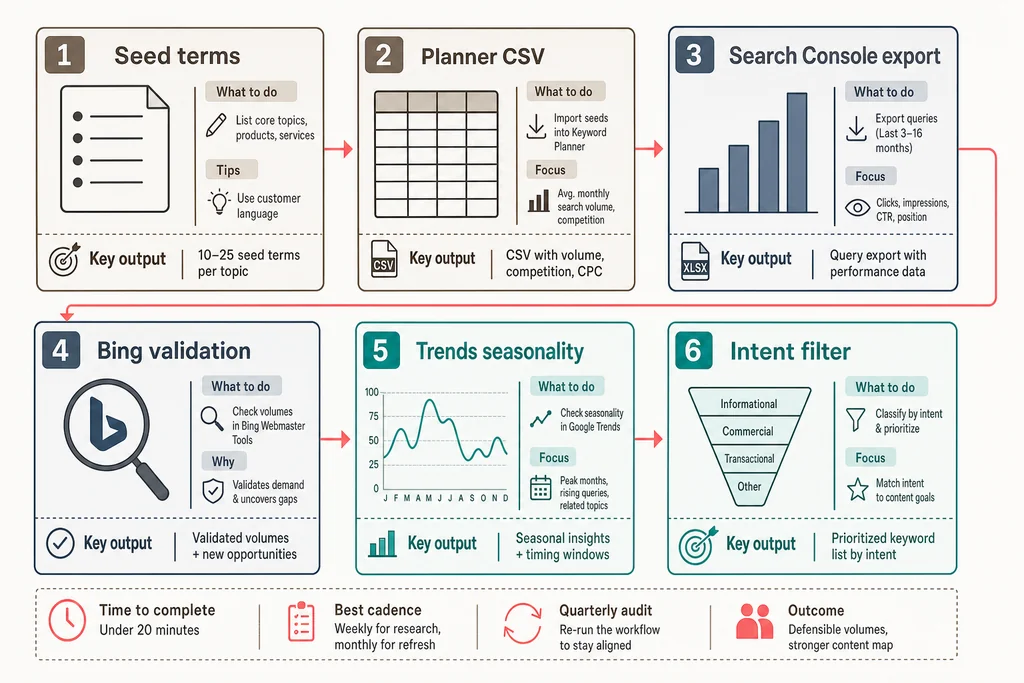
Seed list creation. Write down 3–5 core phrases that describe your business, pulled from your homepage and service pages. Avoid single‑word seeds—they generate too many broad matches. “B2B email marketing” performs better than “marketing.”
Bulk discovery with Google Keyword Planner. Feed the seeds into the “Discover new keywords” text box, select your target country, and download the full CSV. Don’t cherry‑pick from the UI. The Use Keyword Planner documentation covers filtering and exporting steps.
Enrich with Search Console query data. Open the Performance report, set a 6‑month window, and export queries with the most impressions but low CTR. Those are often keywords you rank for but haven’t optimized against. Add them to your working sheet.
Validate with Bing Webmaster Tools. Run the same seeds through Bing’s Keyword Research tool. Note the volume numbers in a separate column. You now have two independent volume signals.
Seasonality check with Google Trends. For any keyword tied to events, holidays, or quarterly cycles, plot it in Trends. Add a “publish by” column that shifts the content deadline to about six weeks before the expected peak.
Intent qualification. Volume alone is a traffic proxy, not a revenue signal. The CPC column from the Planner and the presence of shopping ads or local packs in the SERP indicate commercial intent. If intent is ambiguous, you’ll want to distinguish between raw volume and buyer intent before assigning writing resources.
After you’ve run this workflow a few times, you’ll notice patterns in your market’s keyword landscape. Capture those. A systematic keyword stack audit twice a quarter will keep your content map aligned with what people actually search for, especially as AI‑driven search continues to reshape query behavior.
A quick-reference checklist to sidestep the most frequent free-tool traps:
- Seasonal averaging — The Planner’s 12‑month average smears peaks and troughs; pair it with Trends.
- Intent blindness — High volume without commercial intent produces traffic that rarely converts.
- Misreading competition — Planner competition measures advertiser demand, not organic difficulty.
- Static assumptions — Monthly search volumes shift with market changes; recheck your top terms quarterly.
Taking the average literally for volatile terms. The Planner’s 12‑month average compresses peaks and valleys into one number. A conversion‑rate optimization agency I worked with planned a major guide around “landing page examples” after seeing a Planner estimate of 2,400 monthly searches. What the average hid: the term spikes every August during back‑to‑school campaigns and drops to 400 in January. The agency published in February and wondered why traffic didn’t arrive. Always check Trends for any term that could be seasonal.
Ignoring search intent behind the figure. A keyword can attract thousands of searches and still produce zero revenue‑relevant traffic. “Free pdf converter” has high volume and near‑zero commercial intent; someone typing that query isn’t evaluating software, they’re trying to solve a one‑time file task. Before you commit to a keyword, ask whether a person using that phrase in a search box is ready to compare products, request a demo, or download a resource.
Relying on one source for competitive difficulty. The Planner’s competition column reflects advertiser demand, not organic ranking difficulty. If you can’t access a dedicated difficulty metric from a paid tool, manually scan the top five results. If every listing belongs to a government site, a university domain, or a brand with tens of thousands of backlinks, treat the keyword as high‑effort regardless of the volume number. No amount of well‑structured content will outrank nih.gov for “clinical trial design guidelines” without years of authority building.
Assuming volume is static. Search behavior shifts as products launch, regulations change, and user habits evolve. A term that generated 1,500 monthly searches in Q1 might sit at 400 by Q3. Once a quarter, re‑run your top 20 keywords through the Planner and note any material drops. That’s your signal to either update the associated content or deprioritize it in favor of rising terms.
Review SiaSEO — the operating system for structured SEO content production.
Questions you’ll run into with free volume tools
Can I get reliable volume without a Google Ads account? Yes, but your options narrow. Bing Webmaster Tools works without any ad account, and Search Console gives impression data that correlates with volume. If you’re willing to create a Google Ads account but not run campaigns, you unlock the Planner’s full dataset; that account remains free.
Why do free tools often hide exact volume numbers? Maintaining accurate, country‑level volume databases is expensive. Services that don’t own a search index must purchase third‑party data or scrape SERPs, so they meter precise access behind paid plans. The tools described here avoid that cost by using first‑party engine data directly.
How accurate are Bing’s volume numbers compared to Google’s? Bing’s volume numbers are precise for searches within the Bing ecosystem. Because the user base differs—Bing skews older and more desktop‑heavy in the US—the absolute volume for most informational terms will be lower than Google’s. The value comes from comparing the two to flag inflated or phantom volume on either side.
Why does the Planner show different volume numbers for the same keyword on different days? Google recalculates the 12‑month rolling average periodically and may change the coverage window or the match‑type grouping. Minor fluctuations are normal; a swing of more than 50% in a week usually means the keyword is being treated with a different match type or the campaign forecast is overriding the average. Stick to the forecast column for stability.